October 2026 Eastvale housing market report: prices up, sales down, and homes taking longer to sell. Here’s what it means for buyers and sellers.

If you own a home in Eastvale, you’ve probably wondered lately: “Is the market slowing down, or is it still strong?” 🤔
October’s numbers give a pretty interesting answer. Fewer homes sold, but the average sale price jumped. Let’s break down what happened and what it could mean for you.
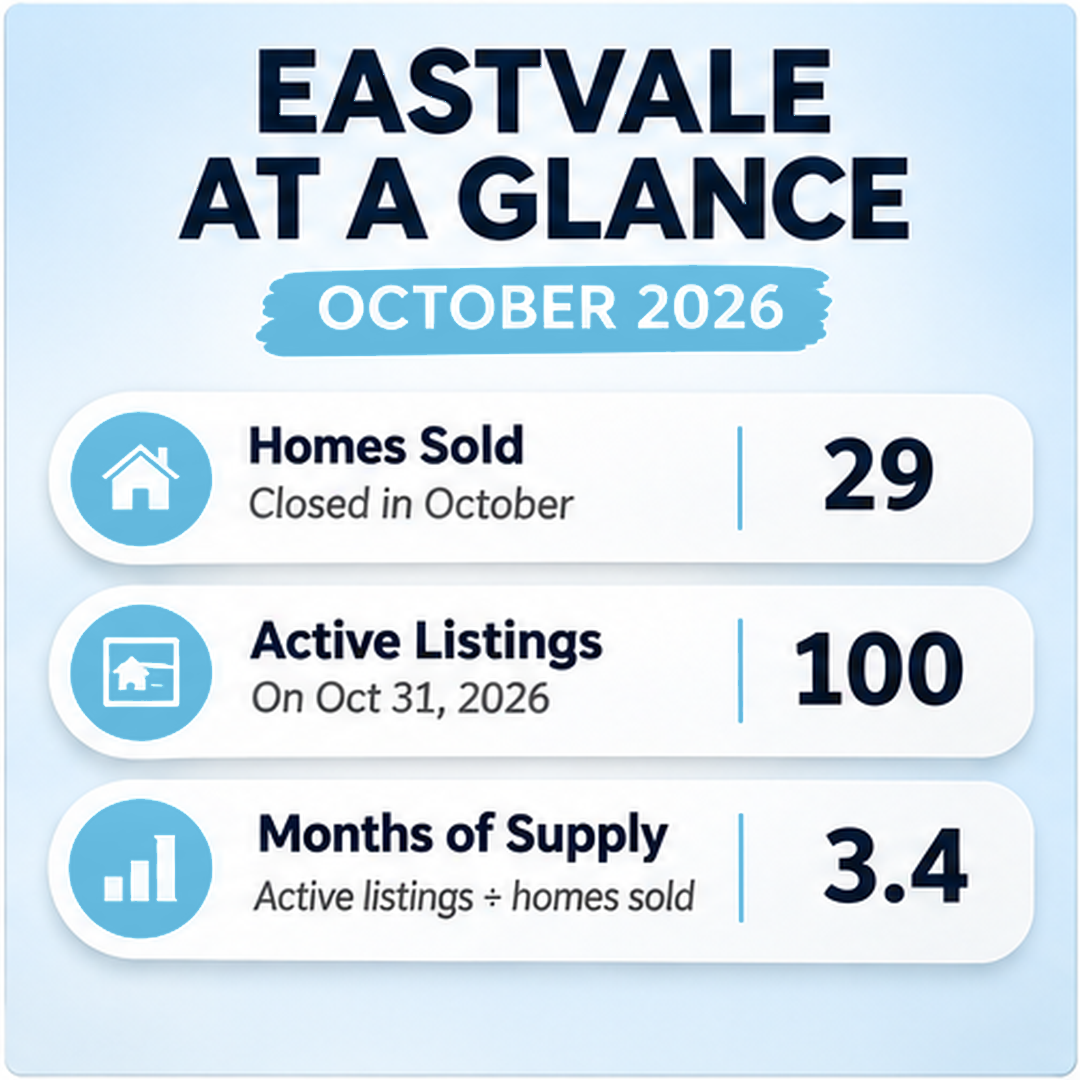
Eastvale Housing Market at a Glance: October 2026 🏡
Homes sold: 29 closed in October
Active listings: 100 on October 31, 2026
Months of supply: 3.4 (active listings ÷ homes sold)
At 3.4 months of supply, Eastvale still leans toward a seller’s market. It’s also more balanced than September’s 2.6 months, which means buyers have a little more room to look around.
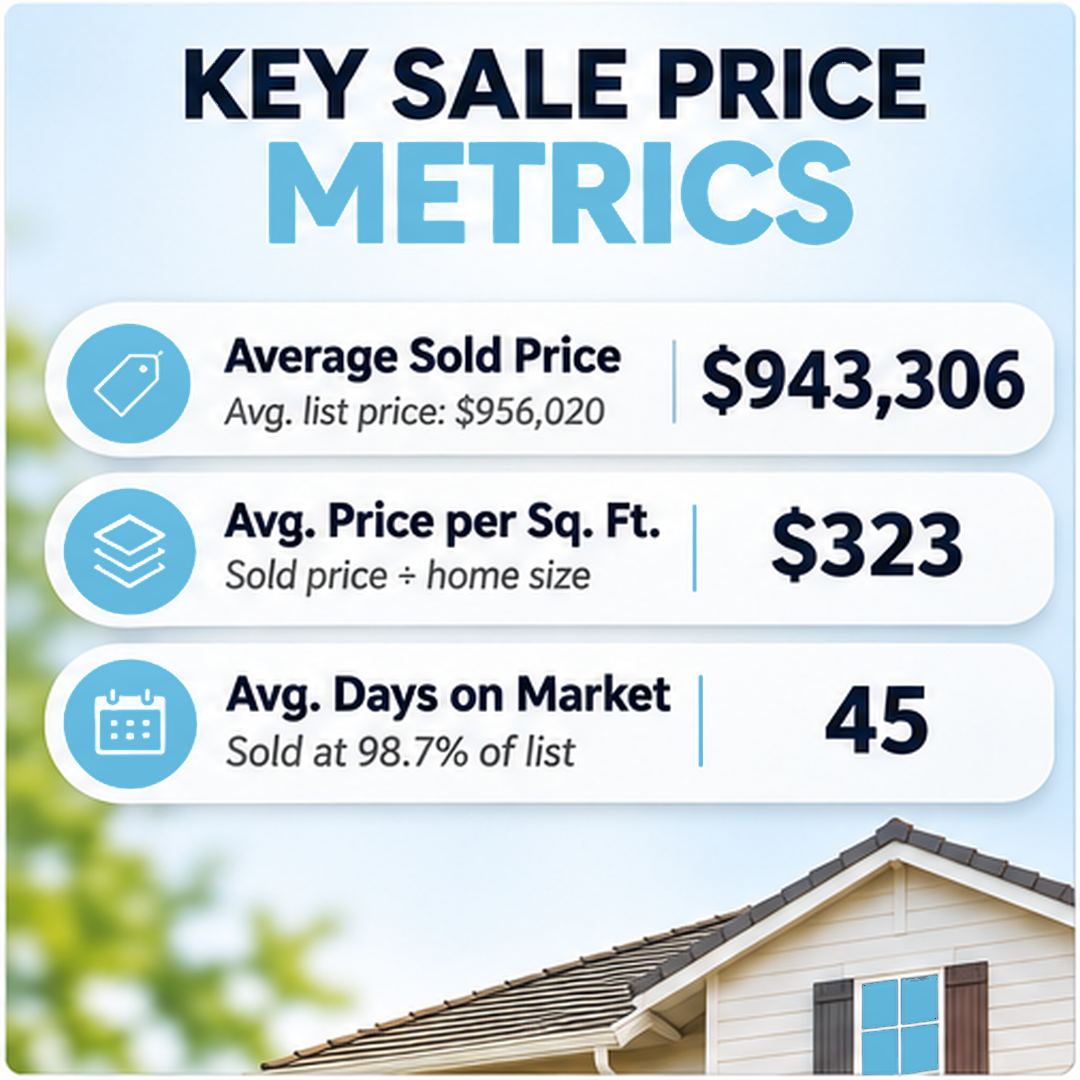
Key Sale Price Metrics 💰
Average sold price: $943,306 (average list price: $956,020)
Average price per sq. ft.: $323
Average days on market: 45 days
Sold-to-list ratio: 98.7%
Homes sold for about 98.7% of their list price, roughly $12,700 below the average asking price. Pricing a home well still matters, and there was some room to negotiate.
Source: CRMLS, Sep. & Oct. 2026
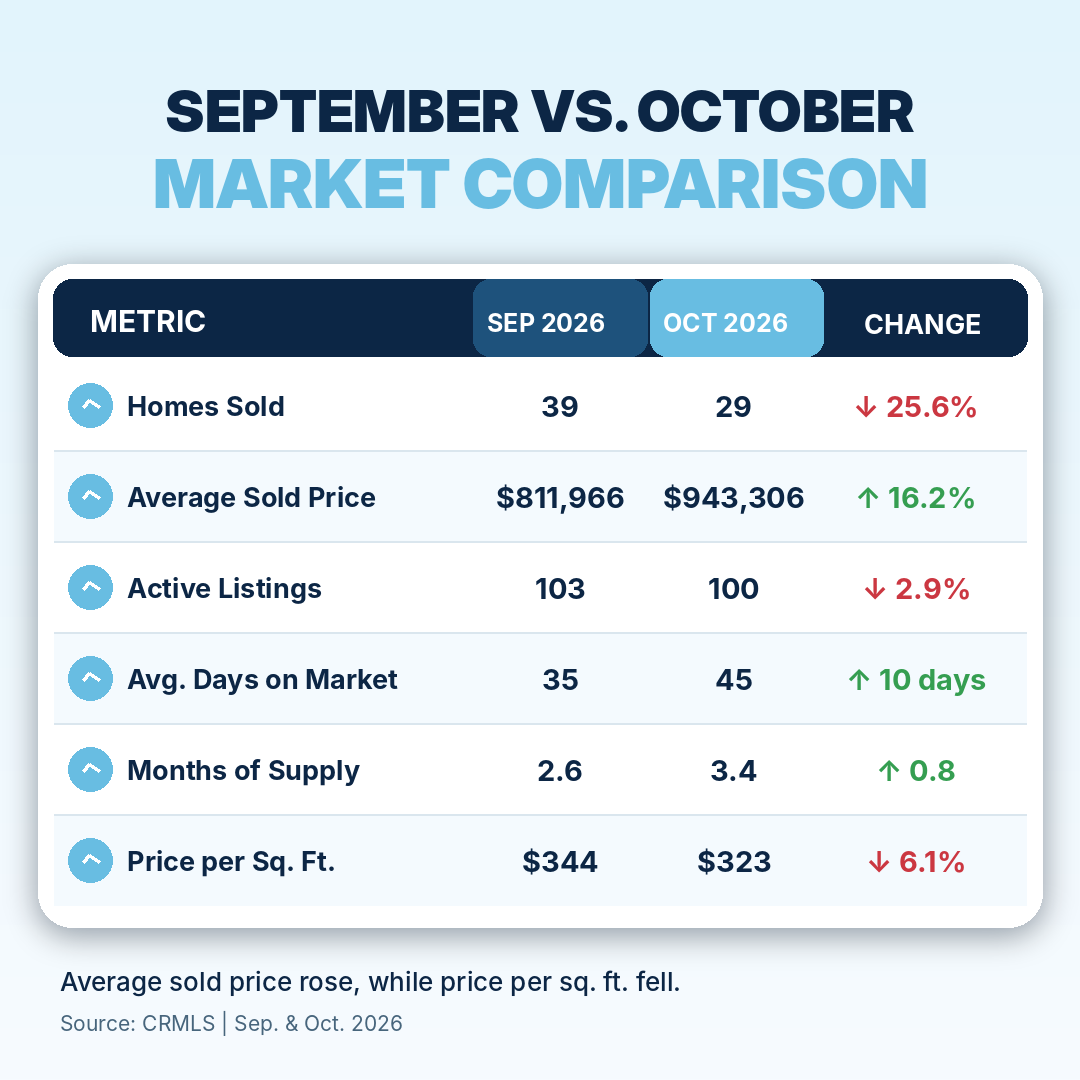
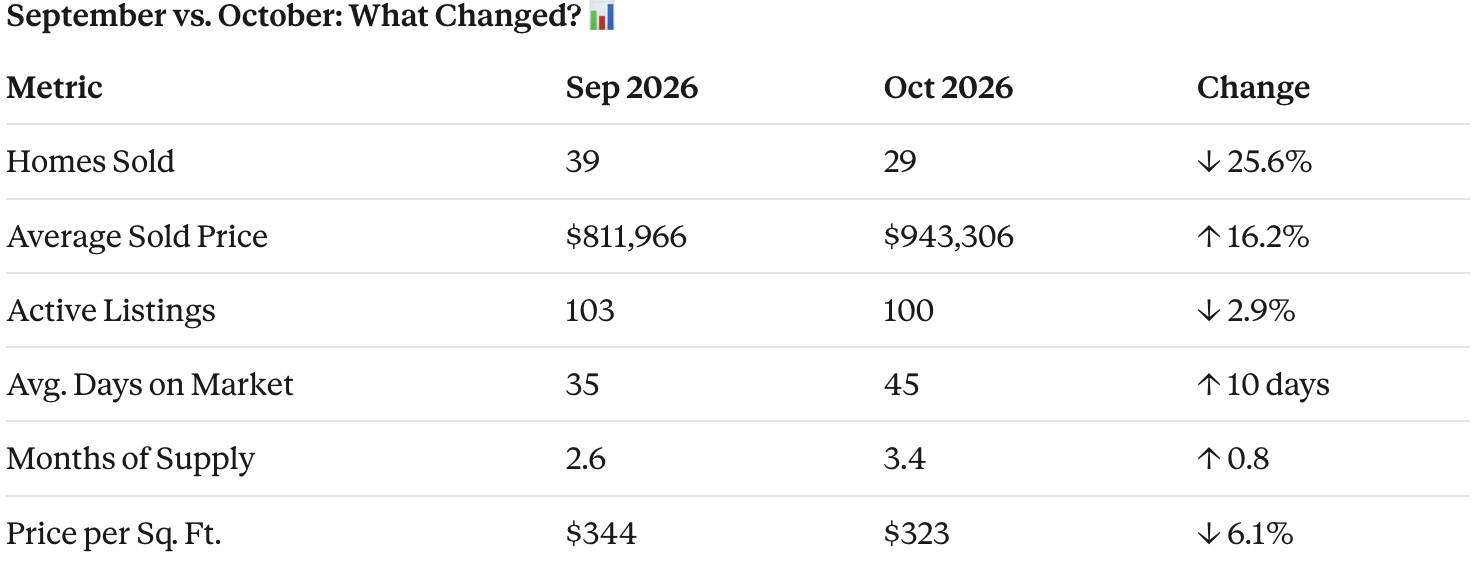
The big story: the average sold price rose 16.2%, but the price per square foot fell 6.1%. That usually means the mix of homes that closed changed. Larger or higher-priced homes made up more of October’s sales, so the higher average doesn’t necessarily mean every home gained value. Looking at price per square foot alongside the average gives a more accurate picture.
Sales volume also slowed, with 10 fewer closings than September, and homes took 10 more days to sell on average. Listings held steady, so supply stretched from 2.6 to 3.4 months. 📈
What This Means for Eastvale Sellers 🔑
Pricing strategy matters. Homes are taking a bit longer to sell, so a well-positioned list price helps.
Presentation counts. Strong photos and a move-in-ready home help you stand out among 100 active listings.
Your home isn’t the average. Value depends on size, condition, and location, so a custom home value analysis will tell you more than a headline number.
What This Means for Eastvale Buyers 🏠
More breathing room. You have more time to compare homes than last month.
Room to negotiate. With homes selling near 98.7% of list, there may be flexibility on price.
Compare smartly. Price per square foot is a helpful way to weigh homes of different sizes.
Final Thoughts ✨
October showed a market that’s shifting rather than stalling. Fewer sales, longer days on market, and more supply point toward a more balanced Eastvale, while prices are holding up well. Whether you’re thinking about selling, buying, or just keeping an eye on your home’s value, the numbers are most useful when you can see how they apply to your own situation.
Let’s Talk About Your Next Move 💬
Curious what October’s numbers mean for your home or your home search? The Provident Real Estate team is happy to walk you through it, with no pressure.
📞 Call: 951.444.8020
🌐 Visit: providentrealestate.com